AWS Machine Learning Blog
Build, Share, Deploy: how business analysts and data scientists achieve faster time-to-market using no-code ML and Amazon SageMaker Canvas
April 2023: This post was reviewed and updated with Amazon SageMaker Canvas’s new features and UI changes.
Machine learning (ML) helps organizations increase revenue, drive business growth, and reduce cost by optimizing core business functions across multiple verticals, such as demand forecasting, credit scoring, pricing, predicting customer churn, identifying next best offers, predicting late shipments, and improving manufacturing quality. Traditional ML development cycles take months and require scarce data science and ML engineering skills. Analysts’ ideas for ML models often sit in long backlogs awaiting data science team bandwidth, while data scientists focus on more complex ML projects requiring their full skillset.
To help break this stalemate, we’ve introduced Amazon SageMaker Canvas, a no-code ML solution that can help companies accelerate delivery of ML solutions down to hours or days. SageMaker Canvas enables analysts to easily use available data in data lakes, data warehouses, and operational data stores; build ML models; and use them to make predictions interactively and for batch scoring on bulk datasets—all without writing a single line of code.
In this post, we show how SageMaker Canvas enables collaboration between data scientists and business analysts, achieving faster time to market and accelerating the development of ML solutions. Analysts get their own no-code ML workspace in SageMaker Canvas, without having to become an ML expert. Analysts can then share their models from SageMaker Canvas with a few clicks, which data scientists will be able to work with in Amazon SageMaker Studio, an end-to-end ML integrated development environment (IDE). By working together, business analysts can bring their domain knowledge and the results of the experimentation, while data scientists can effectively create pipelines and streamline the process.
Let’s deep dive on what the workflow would look like.
Business analysts build a model, then share it
To understand how SageMaker Canvas simplifies collaboration between business analysts and data scientists (or ML engineers), we first approach the process as a business analyst. Before you get started, refer to Announcing Amazon SageMaker Canvas – a Visual, No Code Machine Learning Capability for Business Analysts for instructions on building and testing the model with SageMaker Canvas.
For this post, we will use a synthetic dataset from a telecommunications mobile phone carrier, which can be used for binary classification problem. This sample dataset contains 5,000 records, where each record uses 21 attributes to describe a customer’s profile. Running an entire experiment with this dataset costs you $0 under the SageMaker Canvas Free Tier.
After the model is built, analysts can use it to make predictions directly in SageMaker Canvas for either individual requests, or for an entire input dataset in bulk.

Models built with Canvas Standard build can also be easily shared at a click of a button with data scientists in SageMaker Studio. This allows data scientists to validate the performance of the model you’ve built, provide feedback, and integrate it with existing workflows and systems. Note that at the time of writing it’s not possible to share a model built with Canvas Quick build.
Sharing a model via the Canvas UI is straightforward:
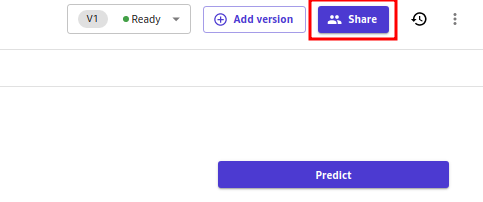
- On the page showing the models that you’ve created, choose a model.
- Choose Share.
The Share Model dialog box opens. In the Share Model dialog box, do the following:
- From the Choose a model version to share dropdown list, select the model version for which you want feedback.
- From the SageMaker Studio users dropdown list, select Studio users by their user-profiles. Note that you can add up to 23 Studio users.
- For the Add a note field, you can enter an optional note that accompanies your model when you send it to the Studio users.
- Choose Share.

- In the Share Model confirmation box that appears, choose Share.
You have now shared your model with the Studio users, and the users will receive a notification in Studio that a model has been shared with them.
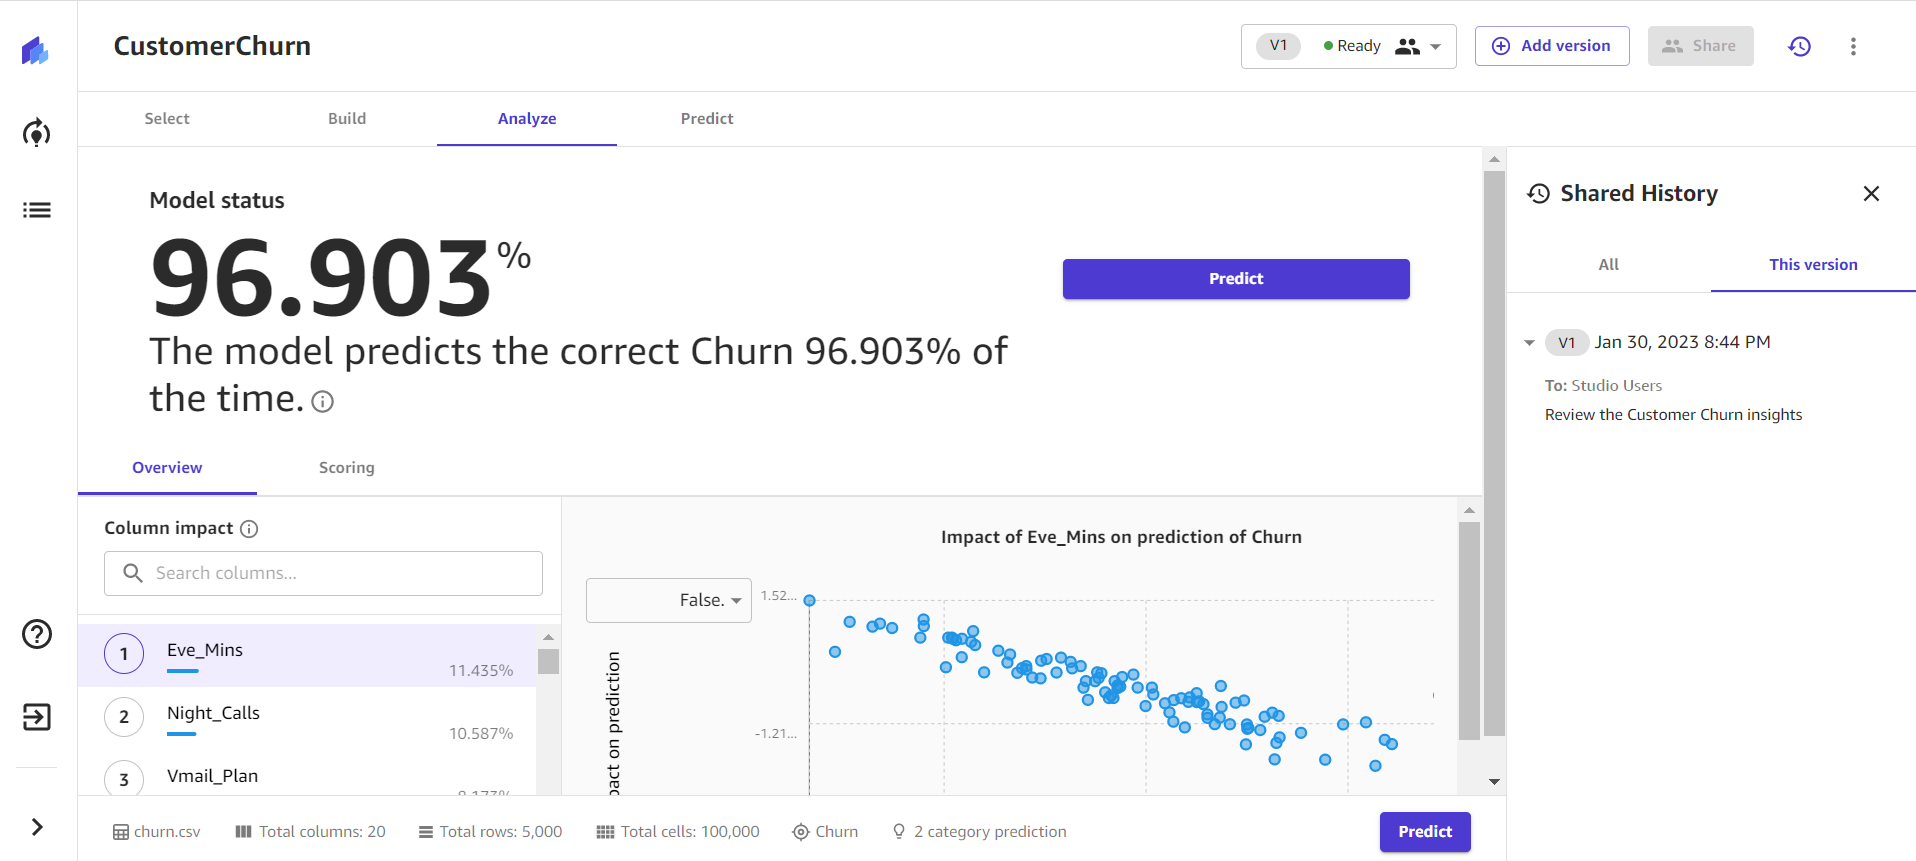
You can click on the Shared History link as shown below and review all the models which are shared with respective Studio Users.
Data scientists access the model information from SageMaker Studio
Now, let’s play the role of a data scientist and see things from their point of view using SageMaker Studio. If a model has been shared with you, you will receive a notification similar to the following when you open the Studio application:
![]()
You can view the shared model by clicking on the link in the notification. Alternatively, you can view all shared models at any time by doing the following:
- Choose the Home icon in Studio’s left menu panel.
- Expand the Models menu in the left panel, then click on Shared models.
The Shared models and notebooks page appears.
- Select the Shared with me filter at the top.
Only models shared with you are displayed.
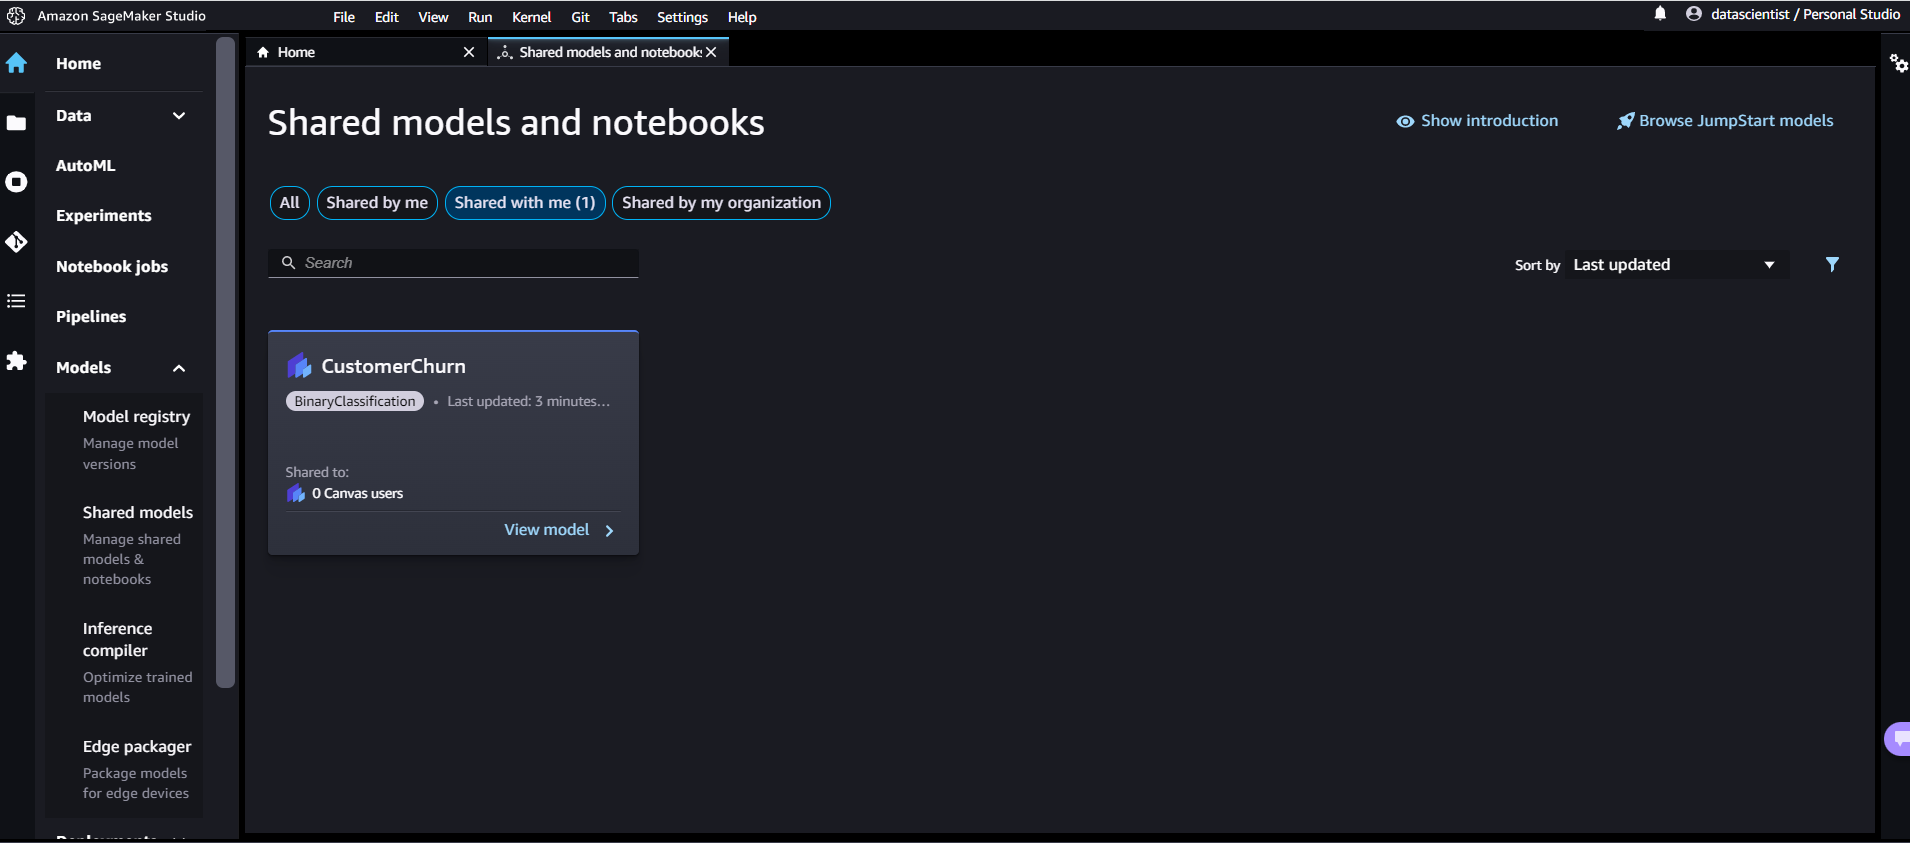
- Click View model on a shared model.
The model details for that model open in the Studio’s AutoML interface. The opened model should have a banner at the top that looks similar to the following screenshot.
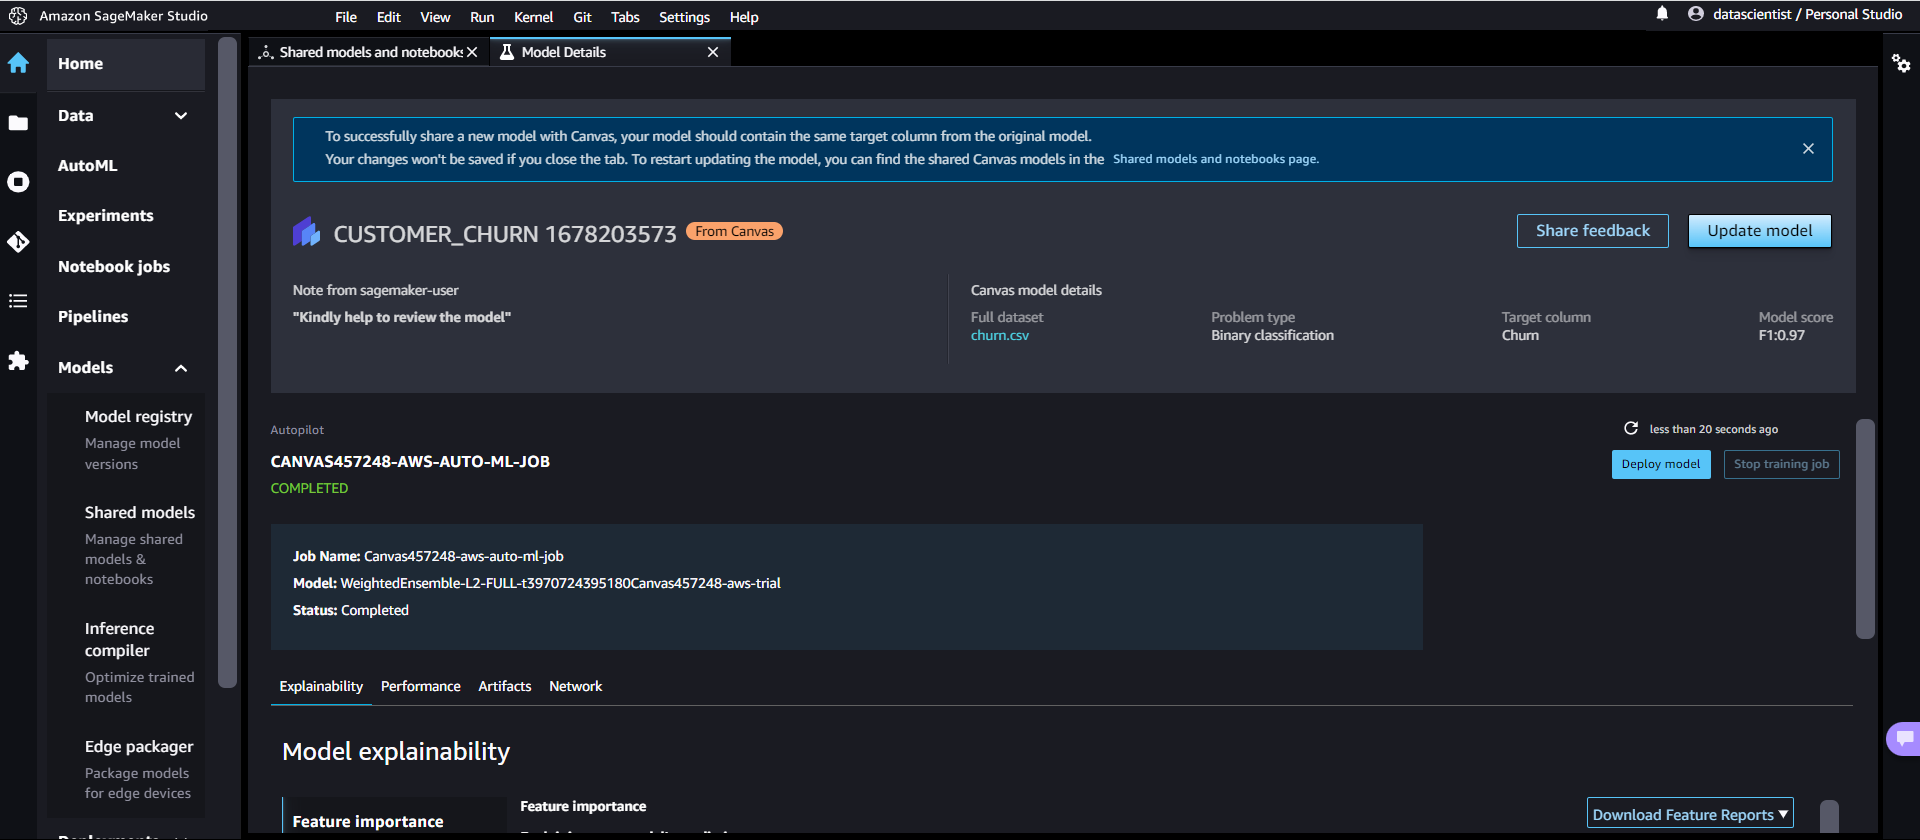
The model details page contains a plethora of useful information regarding the model that performed best with this input data, as well as any notes about the model shared with you by the Canvas user. Let’s first focus on the summary at the top of the page. The preceding example screenshot shows that, out of multiple model training runs, a weighted ensemble model performed best on the input dataset. SageMaker Canvas uses Autopilot and can train multiple types of model, each with a wide variety of preprocessing pipelines and hyperparameters. Amazon SageMaker Autopilot is a feature-set that automates key tasks of an automatic machine learning (AutoML) process. To learn more about each algorithm, refer to Autopilot algorithm support.
SageMaker also includes model explainability using a KernelSHAP implementation. This approach assigns each feature an importance value for a particular prediction. A complete explainability report including feature importance is downloadable in PDF, notebook, or raw data format. In that report, a wider set of metrics are shown as well as a full list of hyperparameters used during the AutoML job. To learn more about how SageMaker provides integrated explainability tools for AutoML solutions and standard ML algorithms, see Use integrated explainability tools and improve model quality using Amazon SageMaker Autopilot.
Finally, the other tabs in this view show information about performance details (confusion matrix, precision recall curve, ROC curve), artifacts used for inputs and generated during the AutoML job, and network details.
To get more details about the Autopilot Job, click AutoML on the left pane and navigate to the respective Autopilot job name.
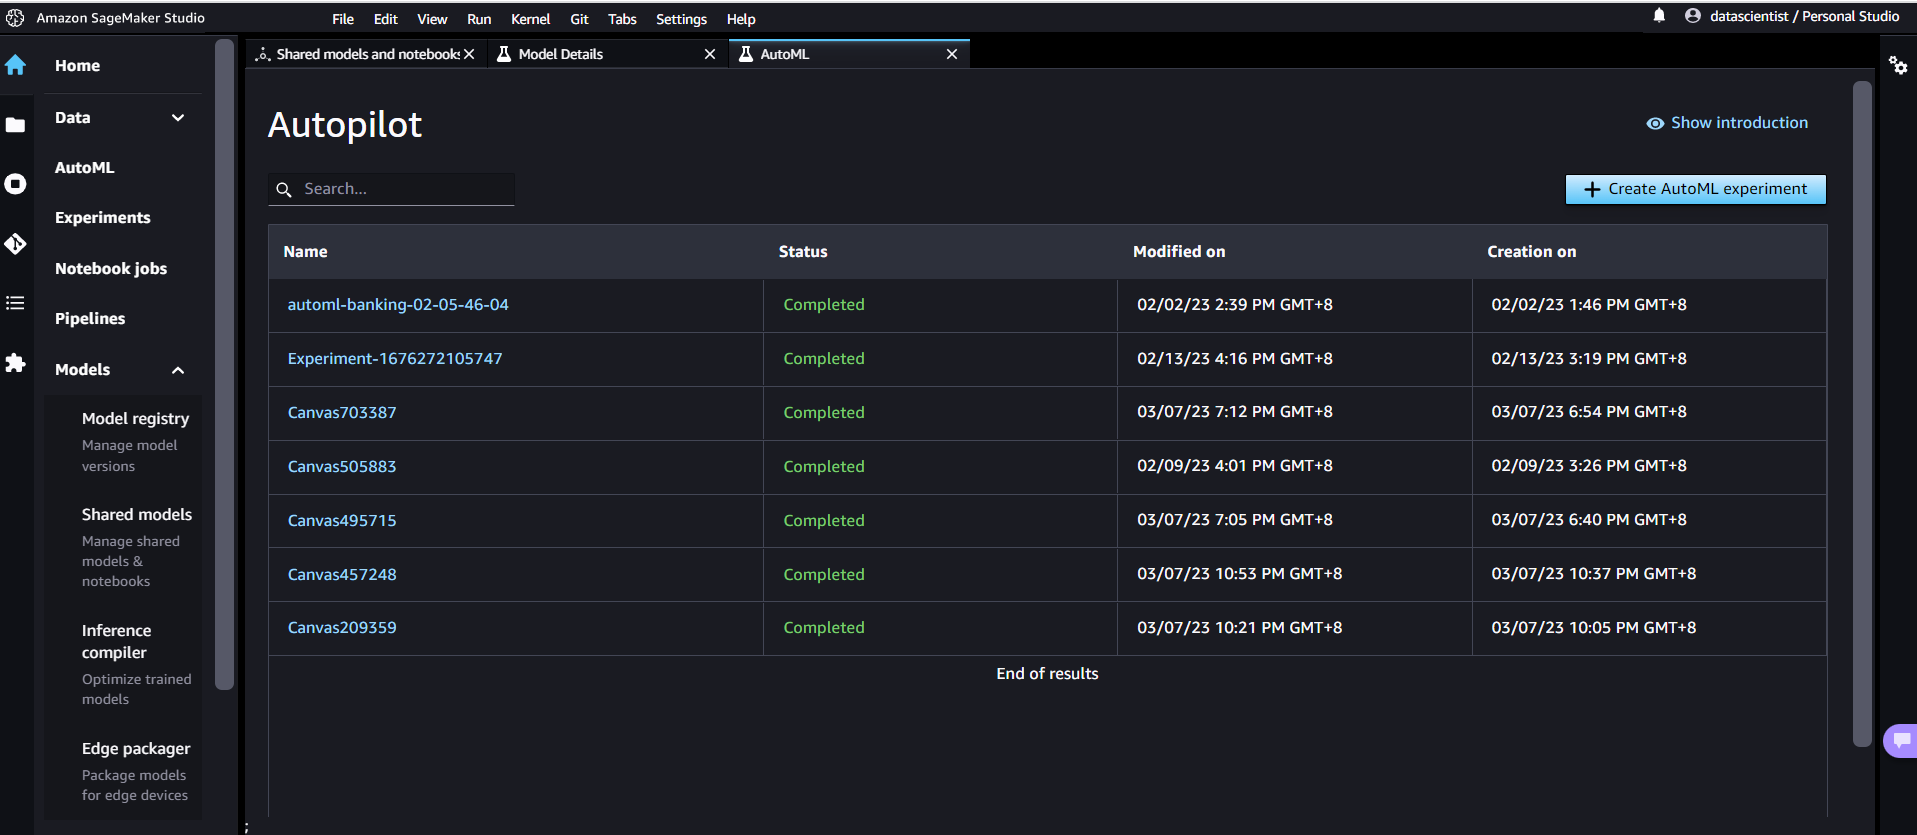
You will be directed to the Autopilot job page, where you will see all trials of the Autopilot experiment, along with respective metrics associated with each trial. You will see the ranking leaderboard of all the candidate models that were created by Canvas, including Autopilot’s suggested best model.

You can analyze statistics and details about the dataset by choosing Open data exploration notebook. This notebook lets you explore the data that was available before training the model, and contains an analysis of the target variable, a sample of the input data, statistics and descriptions of columns and rows, as well as other useful information for the data scientist. To learn more about this report, refer to Amazon SageMaker Autopilot Data exploration report.
The page also contains a list of every model built as part of the AutoML process, sorted by the objective metric. To highlight the best model out of the training jobs launched, a tag with a blue circle is used in the Best Model column. You can also review other metrics used during the training and evaluation phase, such as the accuracy score and the Area Under the Curve (AUC). To learn more about the models that you can train during an AutoML job and the metrics used for evaluating the performances of the trained model, refer to Model support, metrics, and validation.
To learn more about the model, you can click on the model’s Trial Name, or View model details for the best model.
At this point, the data scientist has three choices: directly deploy the model, create a training pipeline that can be scheduled or triggered manually or automatically, or share the model back to the Business Analyst. The following sections provide some insights into these options.
Deploy the model directly
If the data scientist is satisfied with the results obtained by the AutoML job, they can directly deploy the model from the Model Details page. It’s as simple as choosing Deploy model next to the model name.

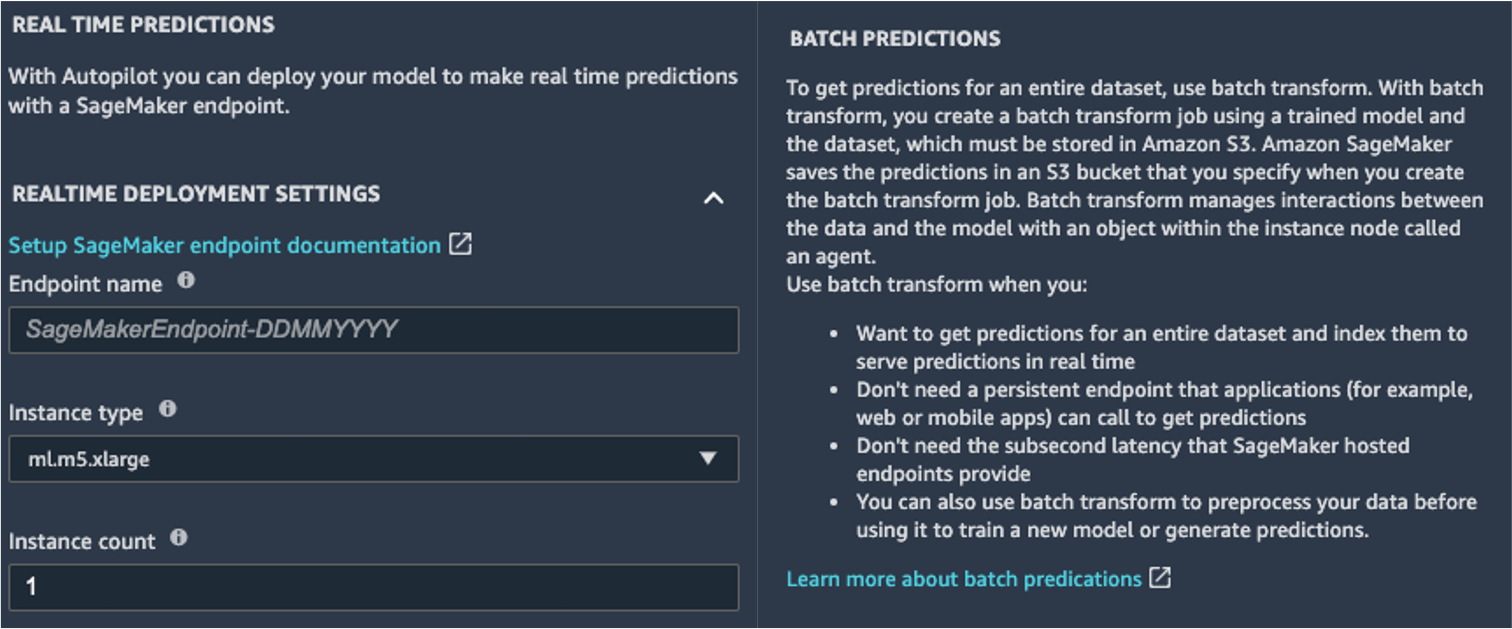
SageMaker shows you two options for deployment: a real-time endpoint, powered by Amazon SageMaker endpoints, and batch inference, powered by Amazon SageMaker batch transform.
SageMaker also provides other modes of inference. To learn more, see Deploy Models for Inference.
To enable the real-time predictions mode, you simply give the endpoint a name, an instance type, and an instance count. Because this model doesn’t require heavy compute resources, you can use a CPU-based instance with an initial count of 1. You can learn more about the different kind of instances available and their specs on the Amazon SageMaker Pricing page (in the On-Demand Pricing section, choose the Real-Time Inference tab). If you don’t know which instance you should choose for your deployment, you can also ask SageMaker to find the best one for you according to your KPIs by using the SageMaker Inference Recommender. You can also provide additional optional parameters, regarding whether or not you want to capture request and response data to or from the endpoint. This can prove useful if you’re planning on monitoring your model. You can also choose which content you wish to provide as part of your response—whether it’s just the prediction or the prediction probability, the probability of all classes, and the target labels.
To run a batch scoring job getting predictions for an entire set of inputs at one time, you can launch the batch transform job from the AWS Management Console or via the SageMaker Python SDK. To learn more about batch transform, refer to Use Batch Transform and the example notebooks.
Define a training pipeline
ML models can very rarely, if ever, be considered static and unchanging, because they drift from the baseline they’ve been trained on. Real-world data evolves over time, and more patterns and insights emerge from it, which may or may not be captured by the original model trained on historical data. To solve this problem, you can set up a training pipeline that automatically retrains your models with the latest data available.
In defining this pipeline, one of the options of the data scientist is to once again use AutoML for the training pipeline. You can launch an AutoML job programmatically by invoking the create_auto_ml_job() API from the AWS Boto3 SDK. You can call this operation from an AWS Lambda function within an AWS Step Functions workflow, or from a LambdaStep in Amazon SageMaker Pipelines.
Alternatively, the data scientist can use the knowledge, artifacts, and hyperparameters obtained from the AutoML job to define a complete training pipeline. You need the following resources:
- The algorithm that worked best for the use case – You already obtained this information from the summary of the Canvas-generated model. For this use case, it’s the WeightedEnsemble built-in algorithm. For instructions on how to use the SageMaker Python SDK to train the WeightedEnsemble algorithm with SageMaker, refer to Use AutoGluon with the SageMaker Python SDK.

- The hyperparameters derived by the AutoML job – These are available in the Explainability section. You can use them as inputs when defining the training job with the SageMaker Python SDK.

You can combine these resources as part of a SageMaker pipeline. We omit the implementation details in this post. You may refer to this blog to read more about Implementing Amazon SageMaker pipeline.
Share the model back to Business Analyst
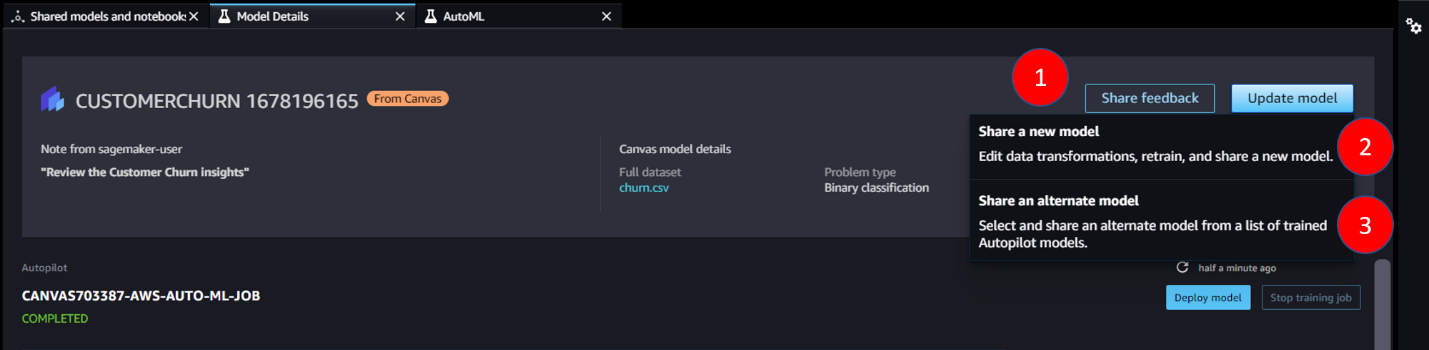
After analyzing the model, there are three ways which you can share the model back to the analyst – share feedback, share a new model, share an alternate model.
- Share feedback
You may decide that the model the Canvas user built is appropriate, and that they can use it on an ongoing basis in Canvas. If this is the case, you can write your findings as feedback and send it back to the Analyst. Select the option Share feedback, a pop-up box will be shown for you to enter feedback and share the model. The Analyst will be able to see that there is 1 new update to the model on Canvas. The feedback can be viewed by clicking on the Shared History.
- Share a new model
You can also perform data transformation on the input dataset and re-train the model with the new data to improve the model’s quality scores. To do so, select the option Share a new model. The model’s recipe opens in Amazon SageMaker Data Wrangler, where you can generate reports about the data, draw further insights, and perform advanced data transformation. Once you are satisfied with the transformed dataset, you can click on Retrain model to begin configuring the new training job. On the new page, you may choose where you want the new dataset to be exported to. Click on Export and train to open another page that directs you to create an Autopilot experiment. Follow through the guided configuration steps on the console to train a new model. The new dataset has already been selected by default as the input data. On the step ‘Deployment and advance settings’, you may also choose to directly deploy the best model. After reviewing and creating the experiment, you can monitor the progress as shown below.
After the model training is completed, the banner at the top of the page compares the metrics of the old model with the updated model. The Best model summary lists the metrics, such as Recall and Precision, and whether the new model improves the metrics or not. Review the metrics and decide whether you would like to share the updated model to the Business analyst. Click on Share in the Canvas banner if you wish to share the model.
- Share an alternate model
When the Business analyst builds a model with Canvas, Amazon SageMaker Autopilot trains multiple versions of the model and selects the model with the best objective metric score. You might decide that an alternate version of the model is better according to your needs. To view all the models trained by the Autopilot job, select the option Share an alternate model. It will open the Autopilot job where you can view all the models and each of their metrics. If you want to share an alternate model, click on Share as shown below. A share dialogue box opens and you may choose the version that you wish to share from the dropdown list. You can also add in feedback for the Canvas user to take note of.
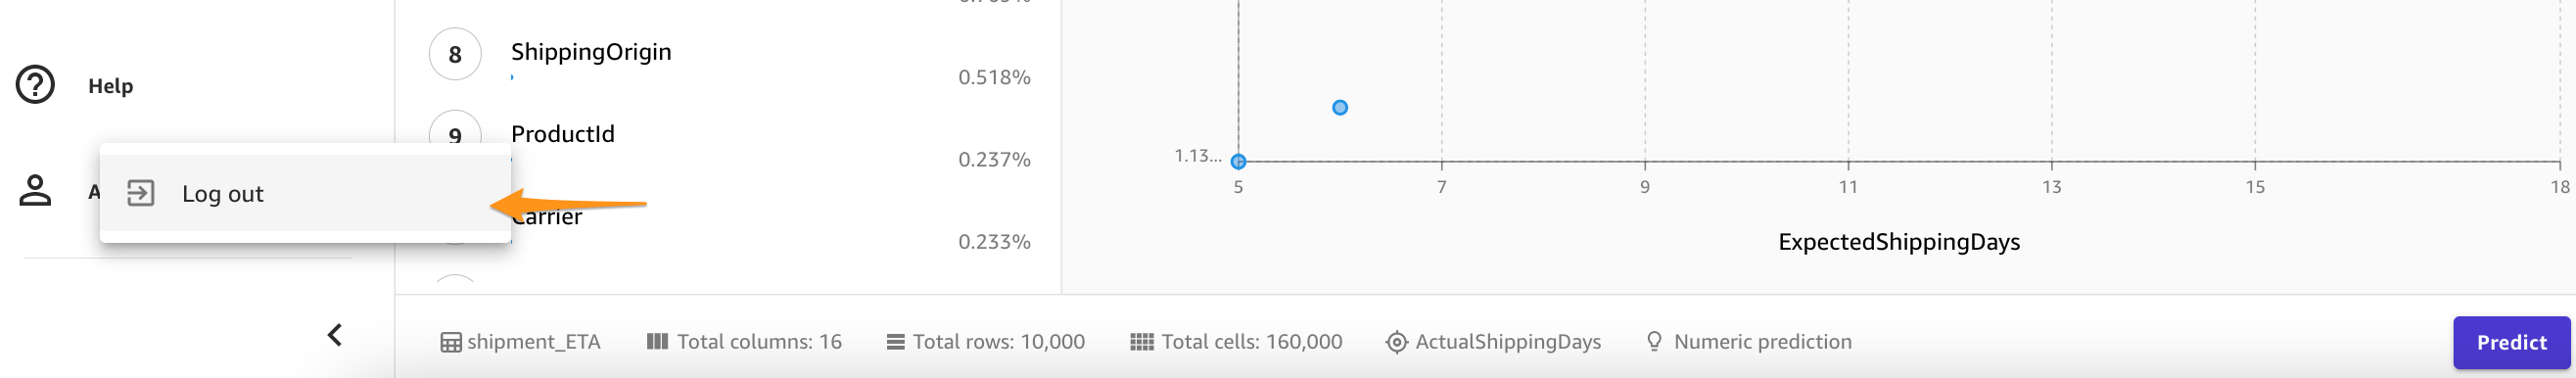
Clean up
To avoid incurring future session charges, log out of SageMaker Canvas.
Conclusion
SageMaker Canvas lets you use ML to generate predictions without needing to write any code. A business analyst can autonomously start using it with local datasets, as well as data already stored on Amazon Simple Storage Service (Amazon S3), Amazon Redshift, or Snowflake. With just a few clicks, they can prepare and join their datasets, analyze estimated accuracy, verify which columns are impactful, train the best performing model, and generate new individual or batch predictions, all without any need for pulling in an expert data scientist. Then, as needed, they can share the model with a team of data scientists or MLOps engineers, who import the models into SageMaker Studio, and work alongside the analyst to deliver a production solution.
Business analysts can independently gain insights from their data without having a degree in ML, and without having to write a single line of code. Data scientists can now have additional time to work on more challenging projects that can better use their extensive knowledge of AI and ML.
We believe this new collaboration opens the door to building many more powerful ML solutions for your business. You now have analysts producing valuable business insights, while letting data scientists and ML engineers help refine, tune, and extend as needed.
Additional Resources
- To learn more about how SageMaker can further help business analysts, refer to Amazon SageMaker for Business Analysts.
- To find out more about how SageMaker allows data scientists develop, train, and deploy their ML models, check out Amazon SageMaker for Data Scientists.
- For more information about how SageMaker can aid MLOps engineers in streamlining the ML lifecycle using MLOps, refer to Amazon SageMaker for MLOps Engineers.
About the Authors
 Davide Gallitelli is a Specialist Solutions Architect for AI/ML in the EMEA region. He is based in Brussels and works closely with customers throughout Benelux. He has been a developer since he was very young, starting to code at the age of 7. He started learning AI/ML at university, and has fallen in love with it since then.
 Mark Roy is a Principal Machine Learning Architect for AWS, helping customers design and build AI/ML solutions. Mark’s work covers a wide range of ML use cases, with a primary interest in computer vision, deep learning, and scaling ML across the enterprise. He has helped companies in many industries, including insurance, financial services, media and entertainment, healthcare, utilities, and manufacturing. Mark holds six AWS certifications, including the ML Specialty Certification. Prior to joining AWS, Mark was an architect, developer, and technology leader for over 25 years, including 19 years in financial services.
 Loke Jun Kai is a Specialist Solutions Architect for AI/ML based in Singapore. He works with customer across ASEAN to architect machine learning solutions at scale in AWS. Jun Kai is an advocate for Low-Code No-Code machine learning tools. In his spare time, he enjoys being with the nature.