AWS Machine Learning Blog
Predict types of machine failures with no-code machine learning using Amazon SageMaker Canvas
Predicting common machine failure types is critical in manufacturing industries. Given a set of characteristics of a product that is tied to a given type of failure, you can develop a model that can predict the failure type when you feed those attributes to a machine learning (ML) model. ML can help with insights, but up until now you needed ML experts to build models to predict machine failure types, the lack of which could delay any corrective actions that businesses need for efficiencies or improvement.
In this post, we show you how business analysts can build a machine failure type prediction ML model with Amazon SageMaker Canvas. SageMaker Canvas provides you with a visual point-and-click interface that allows you to build models and generate accurate ML predictions on your own—without requiring any ML experience or having to write a single line of code.
Solution overview
Let’s assume you’re a business analyst assigned to a maintenance team of a large manufacturing organization. Your maintenance team has asked you to assist in predicting common failures. They have provided you with a historical dataset that contains characteristics tied to a given type of failure and would like you to predict which failure will occur in the future. The failure types include No Failure, Overstrain, and Power Failures. The data schema is listed in the following table.
| Column Name | Data Type | Description |
| UID | INT | Unique identifier ranging from 1–10,000 |
| productID | STRING | Consisting of a letter—L, M, or H for low, medium, or high—as product quality variants and a variant-specific serial number |
| type | STRING | Initial letter associated with productID consisting of L, M, or H only |
| air temperature [K] | DECIMAL | Air temperature specified in kelvin |
| process temperature [K] | DECIMAL | Precisely controlled temperatures to ensure quality of a given type of product specified in kelvin |
| rotational speed [rpm] | DECIMAL | Rotational speed of an object rotating around an axis is the number of turns of the object divided by time, specified as revolutions per minute |
| torque [Nm] | DECIMAL | Machine turning force through a radius, expressed in newton meters |
| tool wear [min] | INT | Tool wear expressed in minutes |
| failure type (target) | STRING | No Failure, Power Failure, or Overstrain Failure |
After the failure type is identified, businesses can take any corrective actions. To do this, you use the data you have in a CSV file, which contains certain characteristics of a product as outlined in the table. You use SageMaker Canvas to perform the following steps:
- Import the maintenance dataset.
- Train and build the predictive machine maintenance model.
- Analyze the model results.
- Test predictions against the model.
Prerequisites
A cloud admin with an AWS account with appropriate permissions is required to complete the following prerequisites:
- Deploy an Amazon SageMaker domain For instructions, see Onboard to Amazon SageMaker Domain.
- Launch SageMaker Canvas. For instructions, see Setting up and managing Amazon SageMaker Canvas (for IT administrators).
- Configure cross-origin resource sharing (CORS) policies for SageMaker Canvas. For instructions, see Give your users the ability to upload local files.
Import the dataset
First, download the maintenance dataset and review the file to make sure all the data is there.
SageMaker Canvas provides several sample datasets in your application to help you get started. To learn more about the SageMaker-provided sample datasets you can experiment with, see Use sample datasets. If you use the sample dataset (canvas-sample-maintenance.csv) available within SageMaker Canvas, you don’t have to import the maintenance dataset.
You can import data from different data sources into SageMaker Canvas. If you plan to use your own dataset, follow the steps in Importing data in Amazon SageMaker Canvas.
For this post, we use the full maintenance dataset that we downloaded.
- Sign in to the AWS Management Console, using an account with the appropriate permissions to access SageMaker Canvas.
- Log in to the SageMaker Canvas console.
- Choose Import.

- Choose Upload and select the
maintenance_dataset.csvfile. - Choose Import data to upload it to SageMaker Canvas.

The import process takes approximately 10 seconds (this can vary depending on dataset size). When it’s complete, you can see the dataset is in Ready status.
After you confirm that the imported dataset is ready, you can create your model.
Build and train the model
To create and train your model, complete the following steps:
- Choose New model, and provide a name for your model.
- Choose Create.

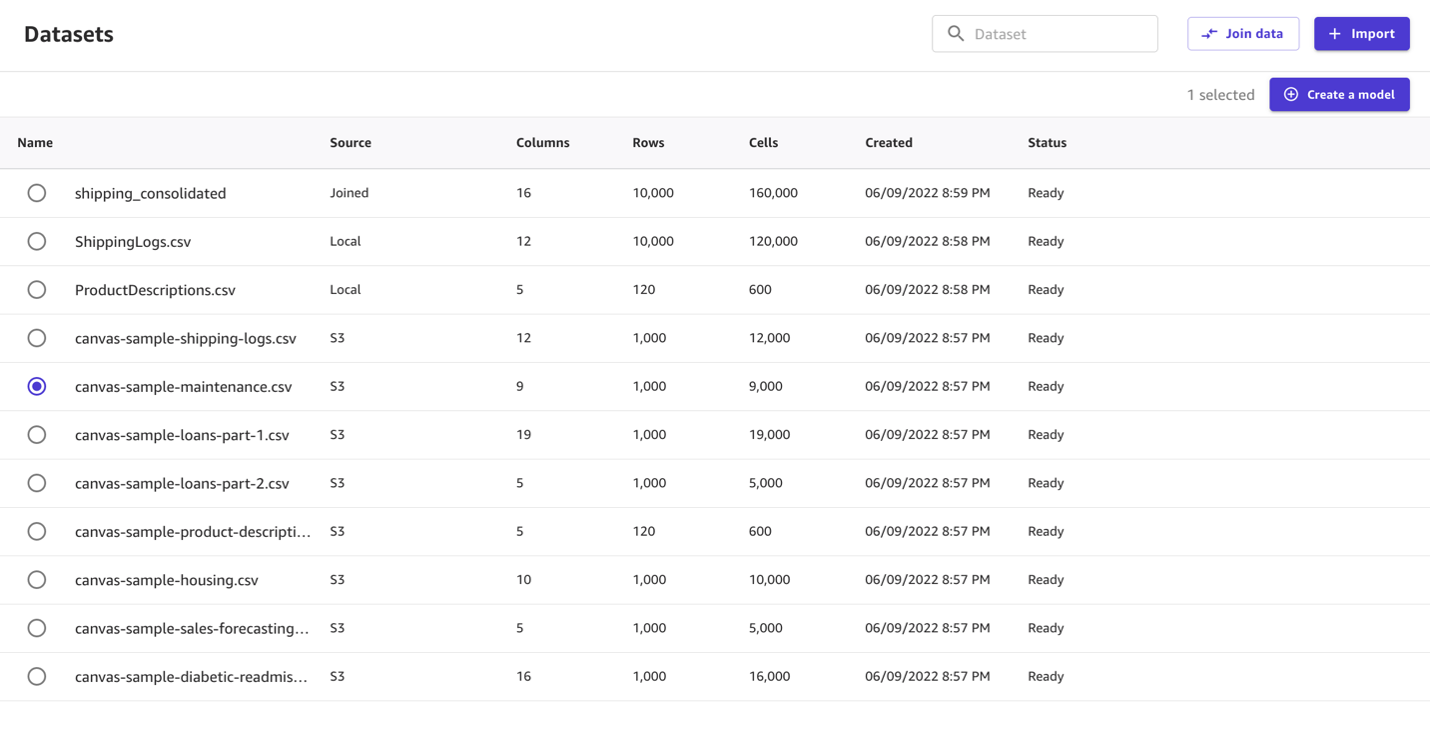
- Select the
maintenance_dataset.csvdataset and choose Select dataset.
In the model view, you can see four tabs, which correspond to the four steps to create a model and use it to generate predictions: Select, Build, Analyze, and Predict. - On the Select tab, select the
maintenance_dataset.csvdataset you uploaded previously and choose Select dataset.
This dataset includes 9 columns and 10,000 rows. SageMaker Canvas automatically moves to the Build phase.
 - On this tab, choose the target column, in our case Failure Type.The maintenance team has informed you that this column indicates the type of failures typically seen based off of historical data from their existing machines. This is what you want to train your model to predict. SageMaker Canvas automatically detects that this is a 3 Category problem (also known as multi-class classification). If the wrong model type is detected, you can change it manually with the Change type option.

It should be noted that this dataset is highly unbalanced towards the No Failure class, which can be seen by viewing the column named Failure Type. Although SageMaker Canvas and the underlying AutoML capabilities can partly handle dataset imbalance, this may result in some skewed performances. As an additional next step, refer to Balance your data for machine learning with Amazon SageMaker Data Wrangler. Following the steps in the shared link, you can launch an Amazon SageMaker Studio app from the SageMaker console and import this dataset within Amazon SageMaker Data Wrangler and use the Balance data transformation, then take the balanced dataset back to SageMaker Canvas and continue the following steps. We are proceeding with the imbalanced dataset in this post to show that SageMaker Canvas can handle imbalanced datasets as well.
In the bottom half of the page, you can look at some of the statistics of the dataset, including missing and mismatched values, unique vales, and mean and median values. You can also drop some of the columns if you don’t want to use them for the prediction by simply deselecting them.
After you’ve explored this section, it’s time to train the model! Before building a complete model, it’s a good practice to have a general idea about the model performance by training a Quick Model. A quick model trains fewer combinations of models and hyperparameters in order to prioritize speed over accuracy, especially in cases where you want to prove the value of training an ML model for your use case. Note that the quick build option isn’t available for models bigger than 50,000 rows. - Choose Quick build.

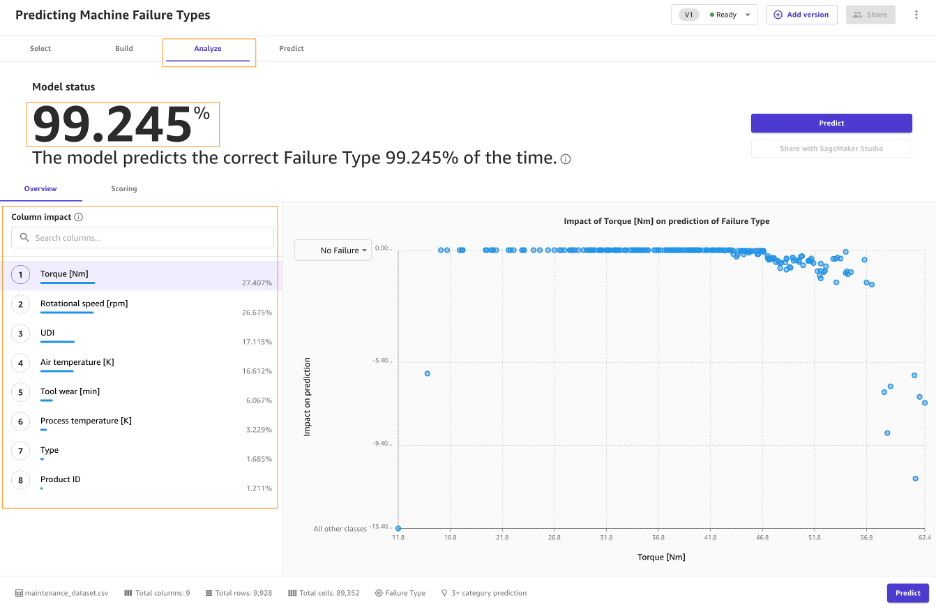
Now you wait anywhere from 2–15 minutes. Once done, SageMaker Canvas automatically moves to the Analyze tab to show you the results of quick training. The analysis performed using quick build estimates that your model is able to predict the right failure type (outcome) 99.2% of the time. You may experience slightly different values. This is expected.
Let’s focus on the first tab, Overview. This is the tab that shows you the Column impact, or the estimated importance of each column in predicting the target column. In this example, the Torque [Nm] and Rotational speed [rpm] columns have the most significant impact in predicting what type of failure will occur.
Evaluate model performance
When you move to the Scoring portion of your analysis, you can see a plot representing the distribution of our predicted values with respect to the actual values. Notice that most failures will be within the No Failure category. To learn more about how SageMaker Canvas uses SHAP baselines to bring explainability to ML, refer to Evaluating Your Model’s Performance in Amazon SageMaker Canvas, as well as SHAP Baselines for Explainability.
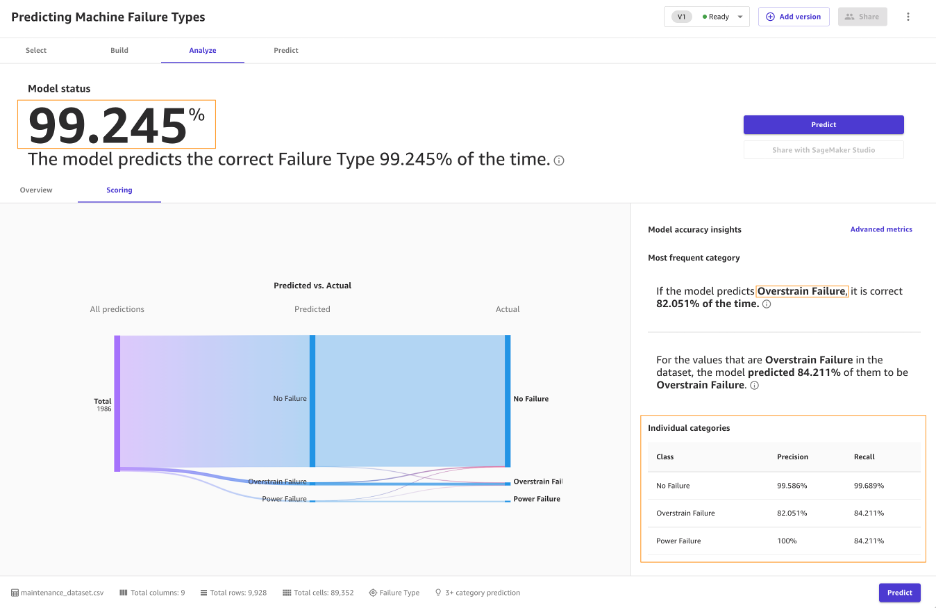
SageMaker Canvas splits the original dataset into train and validation sets before the training. The scoring is a result of SageMaker Canvas running the validation set against the model. This is an interactive interface where you can select the failure type. If you choose Overstrain Failure in the graphic, you can see that model identifies these 84% of time. This is good enough to take action on—perhaps have an operator or engineer check further. You can choose Power Failure in the graphic to see the respective scoring for further interpretation and actions.
You may be interested in failure types and how well the model predicts failure types based on a series of inputs. To take a closer look at the results, choose Advanced metrics. This displays a matrix that allows you to more closely examine the results. In ML, this is referred to as a confusion matrix.

This matrix defaults to the dominate class, No Failure. On the Class menu, you can choose to view advanced metrics of the other two failure types of Overstrain Failure and Power Failure.
In ML, the accuracy of the model is defined as the number of correct predictions divided over the total number of predictions. The blue boxes represent correct predictions that the model made against a subset of test data where there was a known outcome. Here we are interested in what percentage of the time the model predicted a particular machine failure type (lets say No Failure) when its actually that failure type (No Failure). In ML, a ratio used to measure this is TP / (TP + FN). This is referred to as recall. In the default case, No Failure, there were 1,923 correct predictions out of 1,926 overall records, which resulted in 99% recall. Alternatively, in the class of Overstrain Failure, there were 32 out of 38, which results in 84% recall. Lastly, in the class of Power Failure, there were 16 out of 19, which results in 84% recall.
Now, you have two options:
- You can use this model to run some predictions by choosing Predict.
- You can create a new version of this model to train with the Standard build option. This will take much longer—about 1–2 hours—but provides a more robust model because it goes through a full AutoML review of data, algorithms, and tuning iterations.
Because you’re trying to predict failures, and the model predicts failures correctly 84% of time, you can confidently use the model to identify possible failures. So, you can proceed to option 1. If you weren’t confident, then you could have a data scientist review the modeling SageMaker Canvas did and offer potential improvements via option 2.
Generate predictions
Now that the model is trained, you can start generating predictions.
- Choose Predict at the bottom of the Analyze page, or choose the Predict tab.
- Choose Select dataset, and choose the
maintenance_dataset.csvfile. - Choose Generate predictions.
SageMaker Canvas uses this dataset to generate our predictions. Although it’s generally a good idea to not use the same dataset for both training and testing, you can use the same dataset for the sake of simplicity in this case. Alternatively, you can remove some records from your original dataset that you use for training and use those records in a CSV file and feed it to the batch prediction here so you don’t use the same dataset for testing post-training.

After a few seconds, the prediction is complete. SageMaker Canvas returns a prediction for each row of data and the probability of the prediction being correct. You can choose Preview to view the predictions, or choose Download to download a CSV file containing the full output.
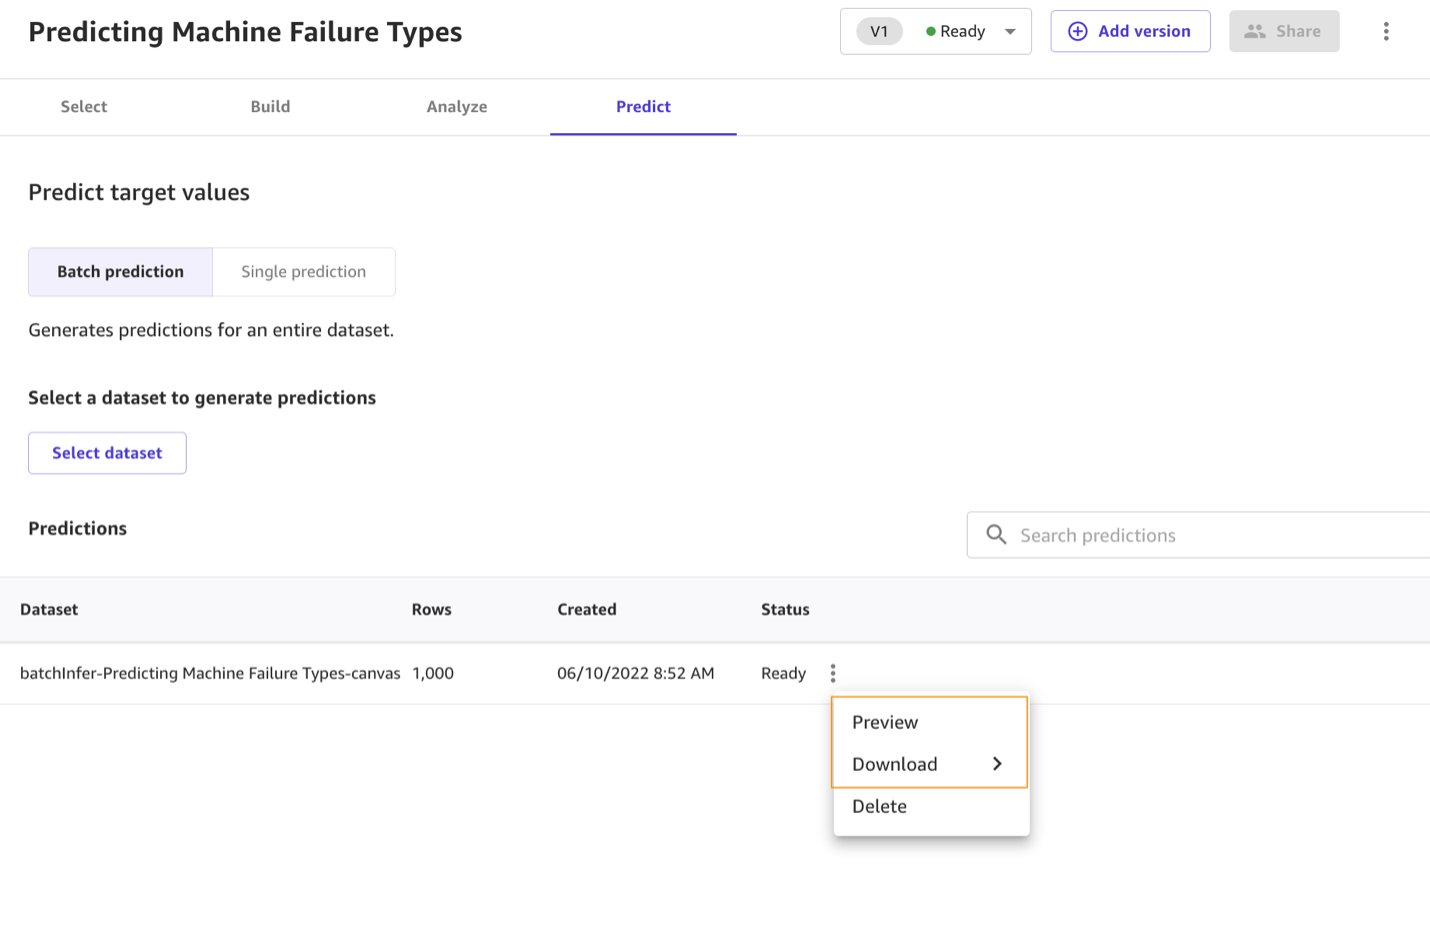
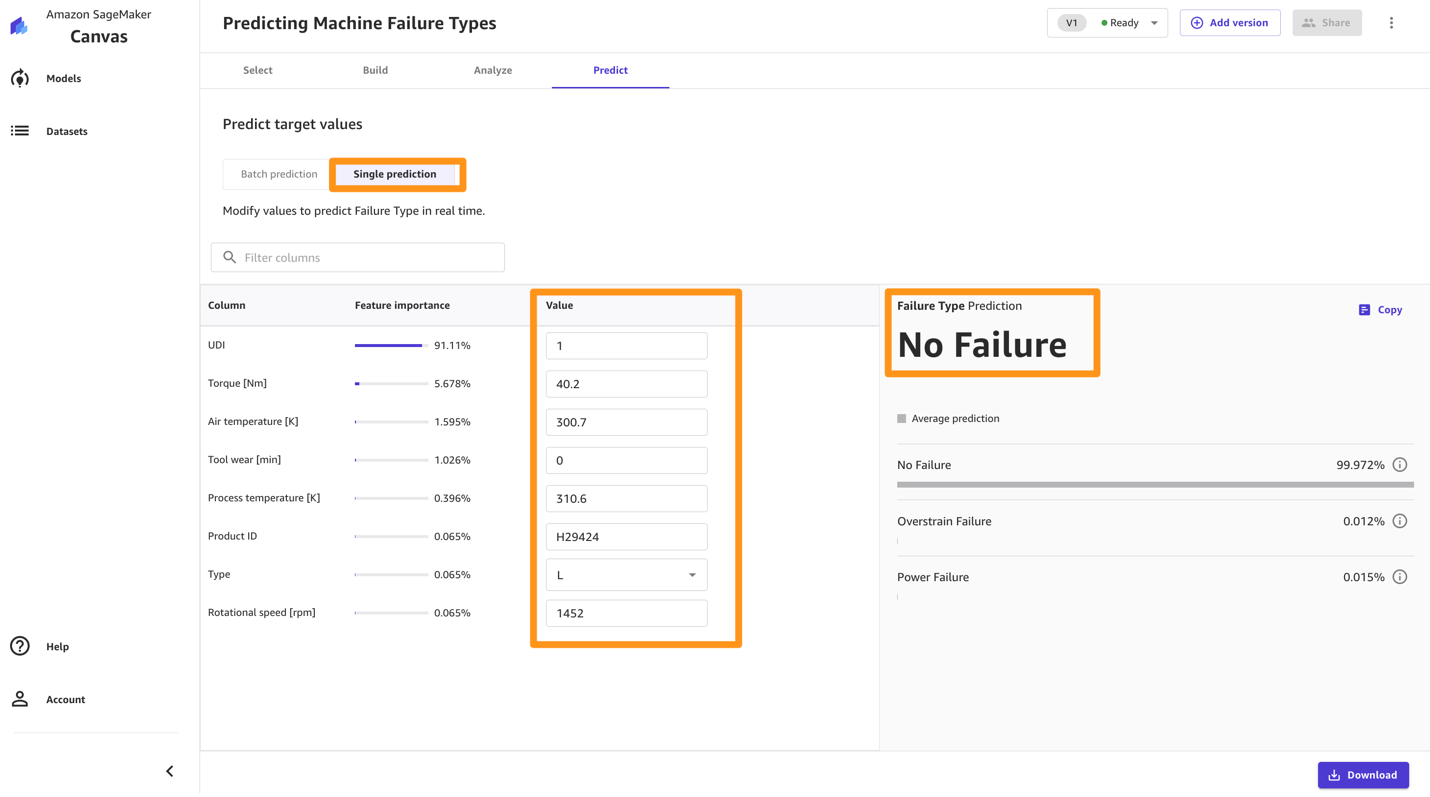
You can also choose to predict one by one values by choosing Single prediction instead of Batch prediction. SageMaker Canvas shows you a view where you can provide the values for each feature manually and generate a prediction. This is ideal for situations like what-if scenarios, for example: How does the tool wear impact the failure type? What if process temperature increases or decreases? What if rotational speed changes?
Standard build
The Standard build option chooses accuracy over speed. If you want to share the artifacts of the model with your data scientist and ML engineers, you can create a standard build next.
- Choose Add version

- Choose a new version and choose Standard build.

- After you create a standard build, you can share the model with data scientists and ML engineers for further evaluation and iteration.

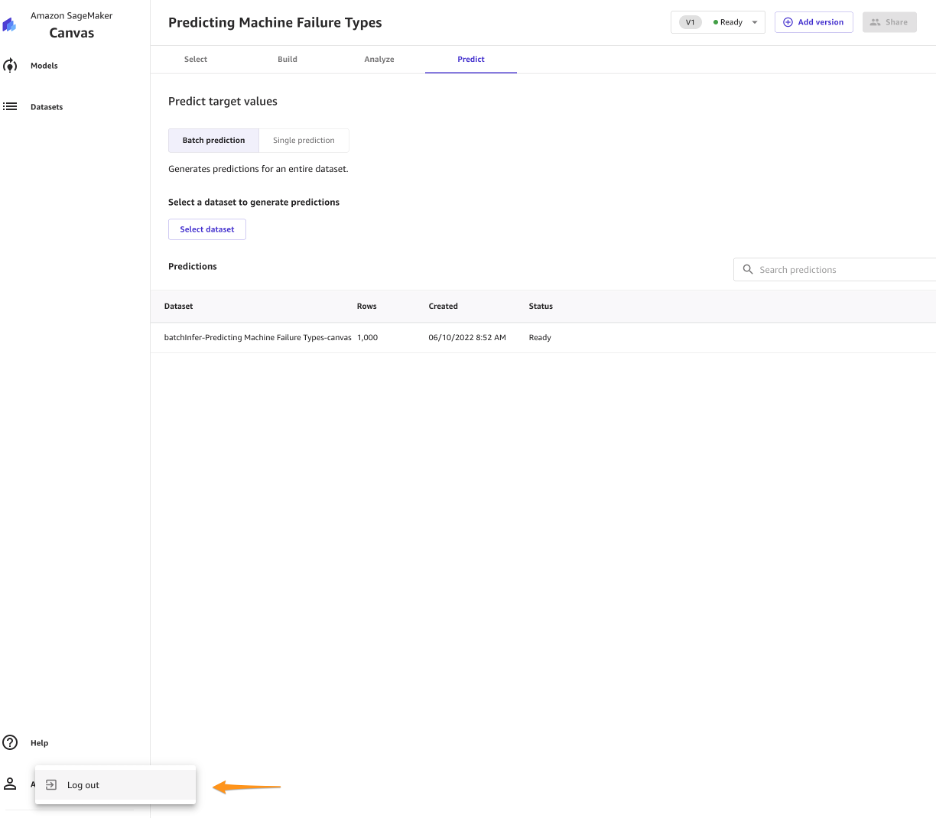
Clean up
To avoid incurring future session charges, log out of SageMaker Canvas.
Conclusion
In this post, we showed how a business analyst can create a machine failure type prediction model with SageMaker Canvas using maintenance data. SageMaker Canvas allows business analysts such as reliability engineers to create accurate ML models and generate predictions using a no-code, visual, point-and-click interface. Analysts can take this to the next level by sharing their models with data scientist colleagues. Data scientists can view the SageMaker Canvas model in Studio, where they can explore the choices SageMaker Canvas made, validate model results, and even take the model to production with a few clicks. This can accelerate ML-based value creation and help scale improved outcomes faster.
To learn more about using SageMaker Canvas, see Build, Share, Deploy: how business analysts and data scientists achieve faster time-to-market using no-code ML and Amazon SageMaker Canvas. For more information about creating ML models with a no-code solution, see Announcing Amazon SageMaker Canvas – a Visual, No Code Machine Learning Capability for Business Analysts.
About the Authors
 Rajakumar Sampathkumar is a Principal Technical Account Manager at AWS, providing customers guidance on business-technology alignment and supporting the reinvention of their cloud operation models and processes. He is passionate about cloud and machine learning. Raj is also a machine learning specialist and works with AWS customers to design, deploy, and manage their AWS workloads and architectures.
 Twann Atkins is a Senior Solutions Architect for Amazon Web Services. He is responsible for working with Agriculture, Retail, and Manufacturing customers to identify business problems and working backwards to identify viable and scalable technical solutions. Twann has been helping customers plan and migrate critical workloads for more than 10 years with a recent focus on democratizing analytics, artificial intelligence and machine learning for customers and builders of tomorrow.
 Omkar Mukadam is a Edge Specialist Solution Architecture at Amazon Web Services. He currently focuses on solutions which enables commercial customers to effectively design, build and scale with AWS Edge service offerings which includes but not limited to AWS Snow Family.